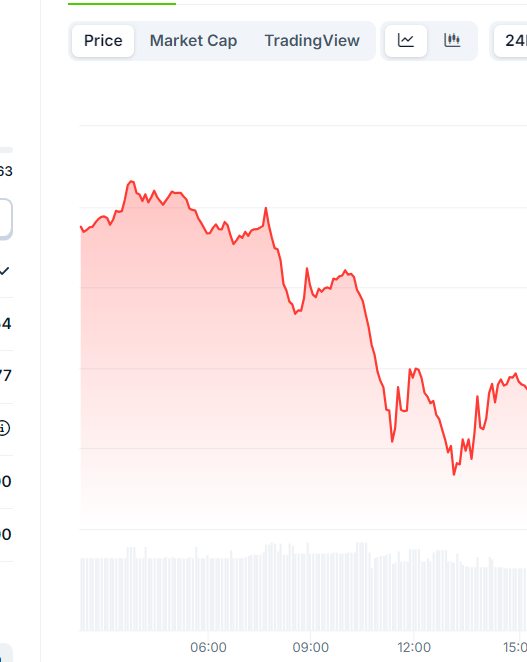
- MOVE crypto has gained by more than 12% in 24 hours after a surge in buying pressure.
- The dropping RSI on the hourly chart suggests that traders who bought during the rally might be booking profits.
Movement [MOVE] has outperformed the rest of the broader market after recording an over 12% gain in 24 hours. At press time, MOVE traded at $0.797 amid a 137% surge in trading volumes per CoinMarketCap.
MOVE’s uptrend has seen its market capitalization surge past $1.79 billion, and the altcoin now ranks as the 61st largest cryptocurrency by this metric.
One of the factors that stirred MOVE’s uptrend was a spike in buying activity as short-term traders sought to book profits during the rally. However, buying volumes appear to have subsided on lower timeframes, which could trigger a downtrend if selling volumes increase.
The Relative Strength Index (RSI) had dropped to 41 at press time, and it was close to oversold regions. While this could precede a short-term correction to the upside, it could suggest that the traders who purchased during the uptrend are beginning to sell.
Source: Tradingview
The green Bollinger Band Trend indicator also shows that bulls have the upper hand despite the spike in selling activity. If buyers reenter the market, it could push the price back to the key resistance level of $0.882.
On the other hand, if the bearish trends persist and buyers fail to step in, MOVE could drop to a crucial support level at the 1.618 Fibonacci level ($0.57).
Analyzing derivatives data
A look at derivatives market data for MOVE crypto shows a significant spike in speculative activity that could drive volatility.
The token’s open interest has increased to $86 million after a slight 1.6% gain in 24 hours. At the same time, volumes across the derivatives market have surged by 96% to $2.35 billion.
The volatile price moves have led to surging liquidations of both long and short positions, with more than $8 million being liquidated in 24 hours.

Source: Coinglass
The long/short ratio of 0.99 shows a neutral market sentiment with short positions being slightly more. However, with this balanced market, there is a reduced risk of a short squeeze or a long squeeze leading to reduced volatility.
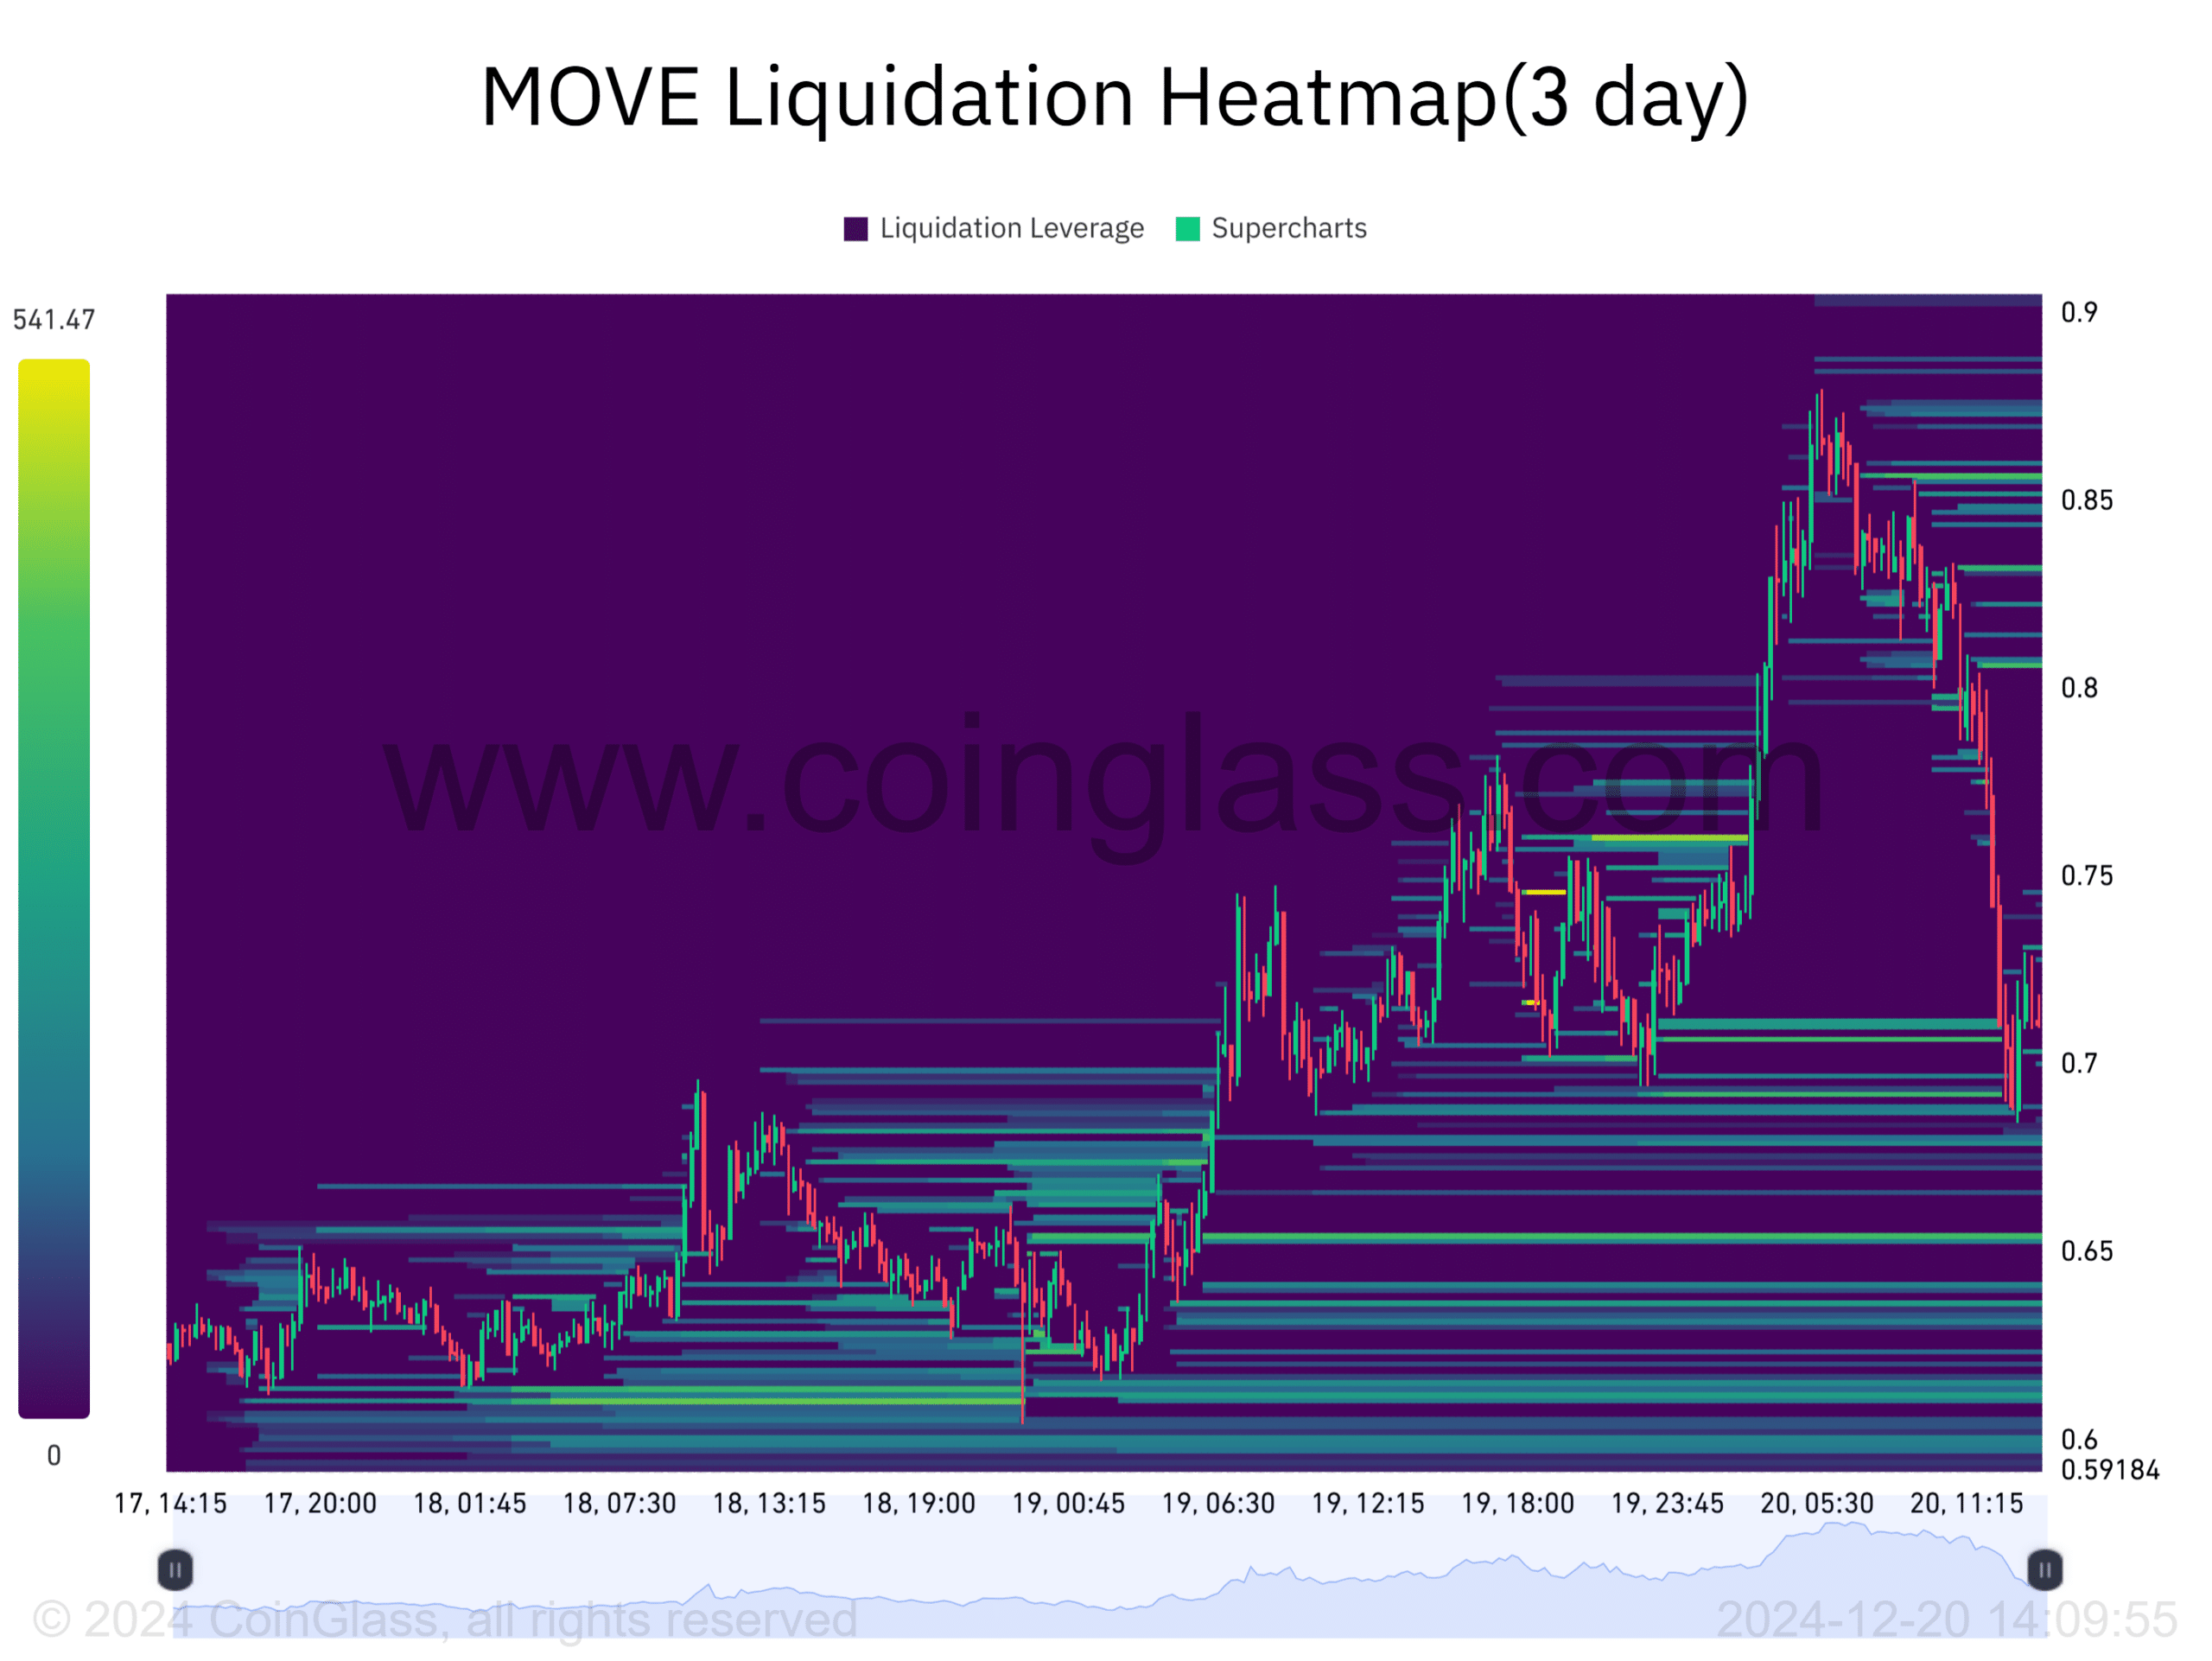
MOVE’s liquidation heatmap shows THIS
The liquidation heatmap for MOVE crypto with a 3-day lookback period shows that the uptrend caused a cascade of short liquidations. As these positions were wiped out, it accelerated the uptrend due to forced buying.

Source: Coinglass
Is your portfolio green? Check the Movement Profit Calculator
On the other hand, there are liquidation clusters below the price that could push MOVE lower. The two zones that traders should watch out for are $0.65 and $0.67.
If MOVE drops to these levels, the resulting closure of long positions could accelerate selling activity, which will fuel the downtrend.


