
Key Takeaways
Why are BTC traders hedging instead of buying?
On-chain and options data indicate concentrated selling between $ 109,000 and $ 115,000, suggesting a defense against upside risk.
What does the current market structure say about BTC’s next move?
Data indicates consolidation. A break above $ 115,000 could trigger renewed bullish momentum, but a failure to do so may see Bitcoin drift back toward $ 105,000.
Bitcoin has recently rebounded above $110,000, drawing cautious positioning from derivatives traders. New on-chain data shows that the latest rally is being used to hedge rather than bet on continued gains.
Options data reveals heavy BTC selling
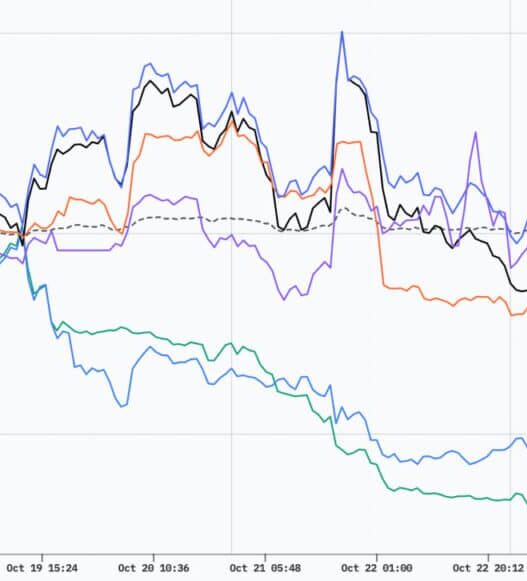
Glassnode’s Options Net Premium Strike Heatmap shows heavy selling activity concentrated between $109,000 and $115,000. This suggests that traders are taking defensive stances.

Source: Glassnode
The pattern implies that the recent move higher is being met with a wave of option premiums written against the upside.
The trend is a sign that institutional participants may be protecting portfolios instead of expecting a breakout.
Futures open interest points to defensive positioning
Open interest data from Coinglass supports that view. Despite Bitcoin’s climb, futures open interest remains elevated, with no major signs of liquidation.
This indicates that traders are maintaining exposure while offsetting risk through options and hedges; a classic sign of a consolidating market.

Source: Coinglass
Rising open interest alongside a flat or slightly declining price often reflects a buildup of neutral or hedged positions, rather than fresh speculative longs.
Technical indicators confirm market indecision
Technical indicators also paint a picture of restraint. On the 12-hour TradingView chart, Bitcoin trades around $110,658, with Bollinger Bands tightening and RSI sitting near the neutral 50 mark.
The narrowing of Bollinger Bands signals volatility compression, a prelude to a decisive move. At the same time, the RSI’s midline position suggests that momentum remains balanced between buyers and sellers.

Source: TradingView
The mid-band resistance at roughly $113,000 aligns closely with the area of concentrated option selling. That convergence of technical and derivative signals strengthens the case for a local ceiling.
Unless Bitcoin breaks and holds above this zone, traders appear more inclined to defend against upside risk than to fuel further rally momentum.
What to expect next
For now, the $108,000–$115,000 range represents the current equilibrium. A sustained push above $115,000 could force short covering and reintroduce bullish pressure.
Conversely, if premiums remain negative and open interest begins to unwind, Bitcoin could slide back toward $105,000 as volatility returns to the market.
With option traders hedging into strength and volatility tightening, Bitcoin’s next major move may hinge on whether demand from spot and ETF flows can overpower this defensive sentiment.
Until then, the data suggest the market is pausing, not panicking, as traders prepare for the next directional breakout.