- BNB and BTC exhibited the lowest drawdowns among top cryptocurrencies, holding near their all-time highs.
- ETH and SOL continued to struggle, reflecting weaker recovery momentum and deeper price declines.
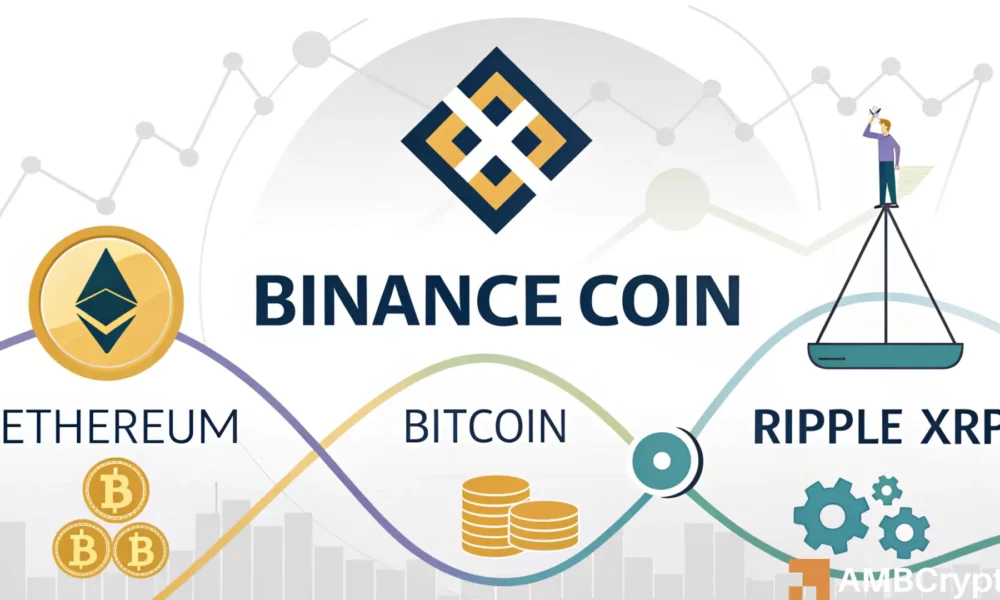
Despite broader market fluctuations, Binance Coin [BNB] and Bitcoin [BTC] have managed to limit their losses better than other top cryptocurrencies.
Their relative strength in the face of recent volatility underscores a growing divergence in crypto market cap performance among the top five digital assets.
BNB and BTC maintain shallow drawdowns
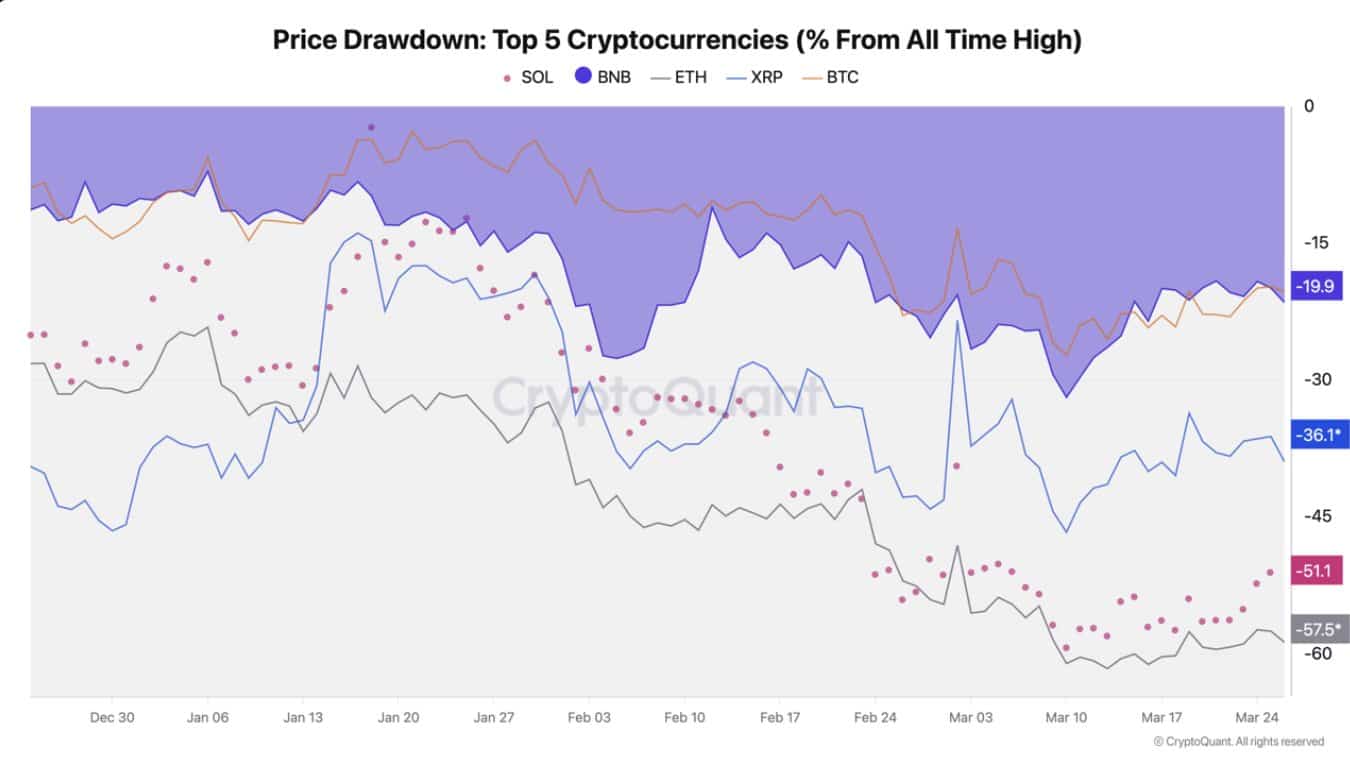
According to CryptoQuant data, the Bitcoin market cap, at press time, was down only 19.9% from its all-time high (ATH), while Binance Coin has dropped around 20%.
These figures place them well ahead of competitors like Ethereum [ETH], Solana [SOL], and Ripple[XRP], which have seen much steeper retracements.
BNB’s resilience can be attributed to its broad utility across the Binance ecosystem. Recently, the network has seen more activity compared to other major networks.
This consistent demand provides a price floor, helping it avoid the deeper drawdowns seen in other crypto market caps.
Source: CryptoQuant
As the market’s flagship asset, BTC continues to act as a bellwether. Its drawdown recovery has remained relatively steady despite ongoing macroeconomic uncertainty and changes in risk appetite.
ETH and SOL lag in market cap recovery
ETH and SOL were facing heavier losses on the other end of the spectrum. At press time, Ethereum was down by 51.1% from its ATH, while Solana has shed 57.5% of its value.
This suggests that these networks are still grappling with structural headwinds despite intermittent rallies, such as scalability concerns in ETH and lingering FTX-related sentiment in SOL.
Source: CryptoQuant
While both assets are backed by strong developer communities and high transaction volumes, their market caps have struggled to reclaim previous peaks.
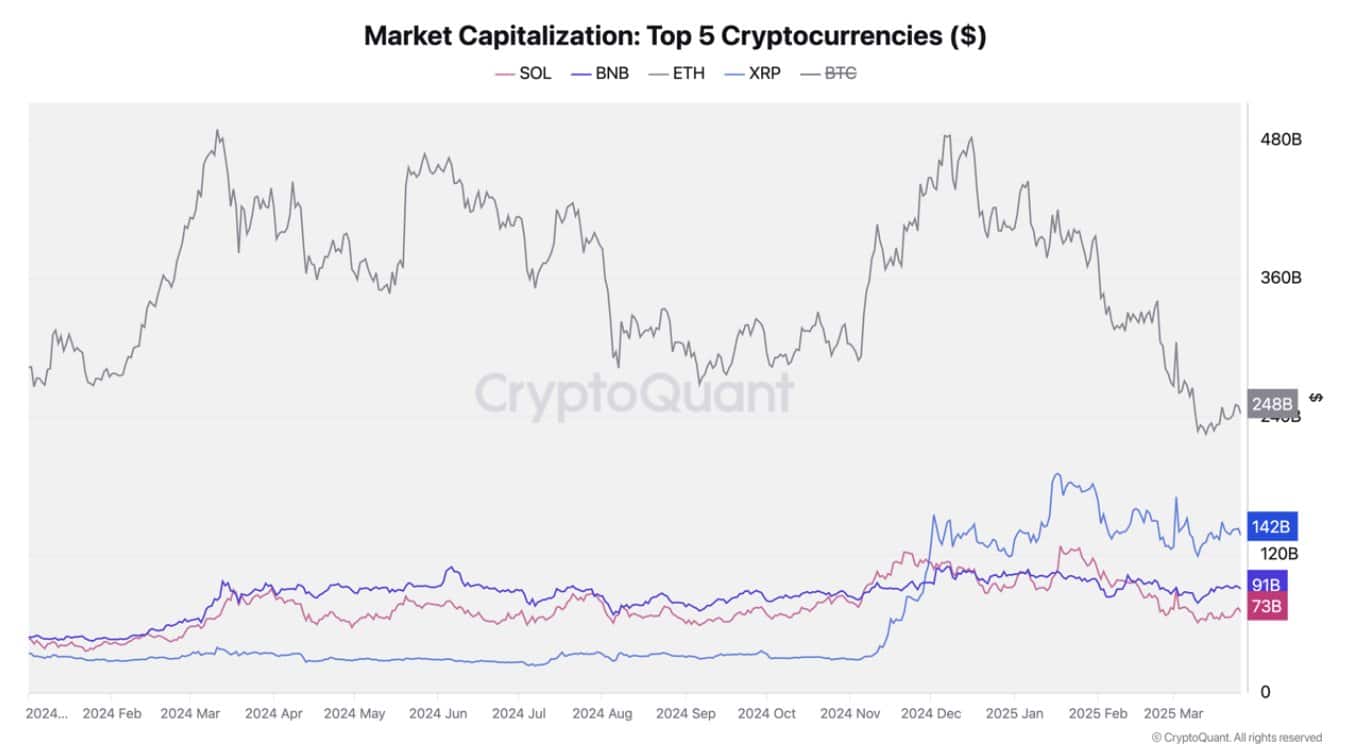
At the time of writing, Ethereum’s market cap sat at approximately $241.68 billion, while Solana trailed further at $73 billion, as shown in CoinMarketCap and CryptoQuant charts.
Crypto market cap shifts reflect the new landscape
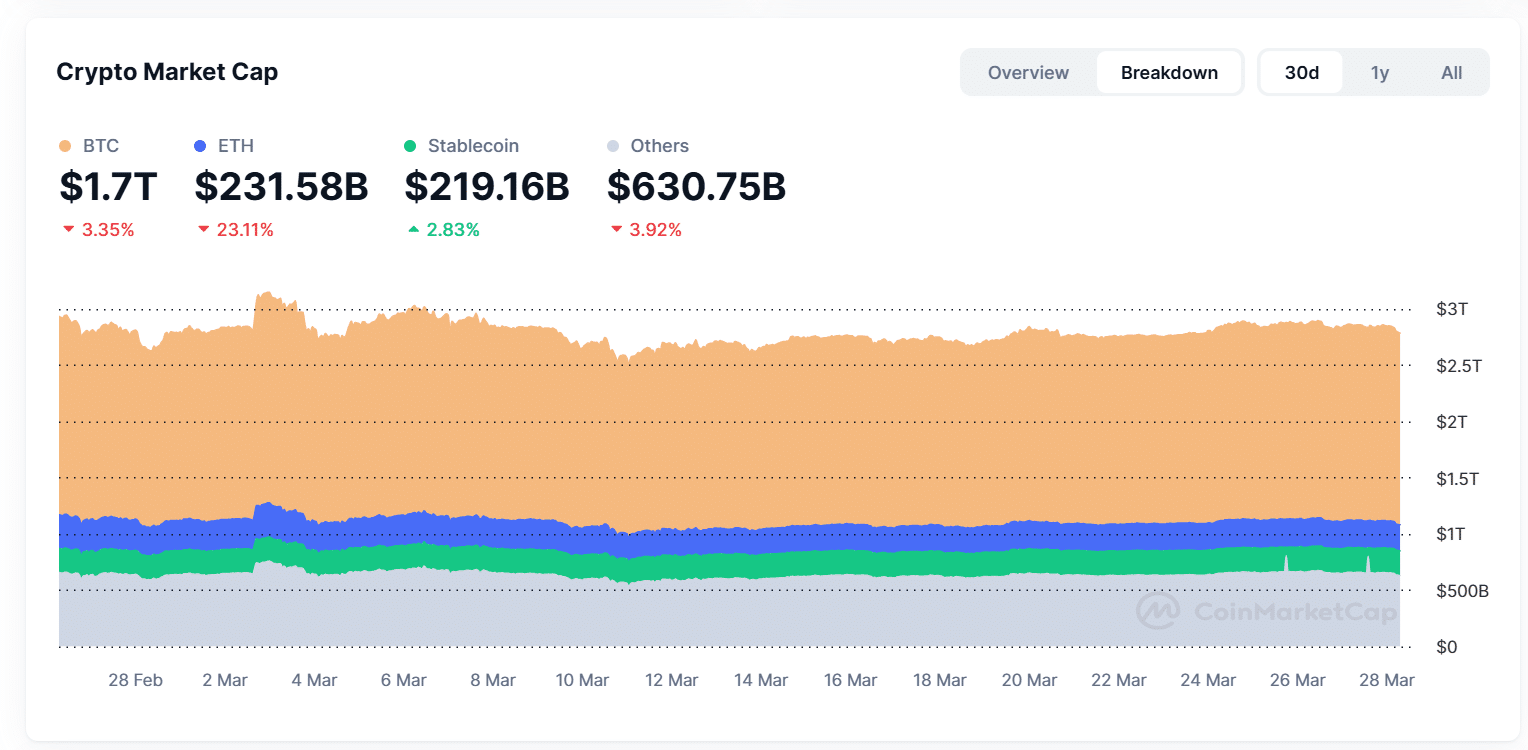
Regarding overall dominance, BTC leads the crypto market cap pack with $1.73 trillion, followed by ETH, BNB, and SOL.
Notably, while BNB and SOL share similar market caps, their trajectories have diverged. BNB remains close to its peak levels, while SOL has been unable to break past resistance.
Source: CoinMarketCap
Meanwhile, stablecoins are experiencing renewed demand, now comprising over $219 billion of the total crypto market, with 2.74% growth in the past month.
This suggests a cautious approach by investors, possibly waiting for clearer momentum before rotating back into volatile assets.
Bottom line
BNB and BTC’s relative resilience in a choppy market reflects both investor confidence and embedded utility. In contrast, ETH and SOL face a steeper climb to reclaim their former highs.
As macroeconomic uncertainty continues and capital rotates selectively, the gap between strong and weak performers in the crypto market cap could widen further.