Regular readers know that we primarily use the Elliott Wave Principle (EWP), to ideally make predictions about the top or bottom that Bitcoin (BTC) will reach. Furthermore, we follow the four-year cycle theory proposed by @CryptoCon_ to predict when these highs and lows should occur.
Specifically, when we track financial assets like Bitcoin, we use objective criteria, namely the standard wave pattern based on Fibonacci levels, which works most of the time. But since financial markets “obligate us to nothing,” as they say, they sometimes move outside these parameters. Therefore, we cannot predict all moves nor all highs and lows. However, just because prices do not follow the standard Fibonacci-based pattern does not mean that the Elliott Wave Principle does not work – quite the opposite. Financial markets – including the Bitcoin market – are complex systems like the weather and cannot always be predicted correctly. But our list of articles shows that we were mostly on the right track. Therefore, applying objective, time-tested criteria always provides proper risk management, which is the most important aspect of trading.
Last chance to take advantage of the discounted price on InvestingPro! Enjoy the benefits of the investment strategy and fundamental analysis platform InvestingPro with a 50% discount on the occasion of the New Year, with an additional discount for readers of our articles, as they receive an additional 10% discount on a two-year Pro+ subscription using the “SAPRO11” coupon here
Moreover, although “past performance is no guarantee of future results,” as we always say, when we learn that Bitcoin has advanced since its inception forming what appears to be a regular pattern, see here and at Figure 1 below, we must assume that this pattern will It continues until proven otherwise.
Figure 1: Bitcoin monthly chart since 2011 with its four-year cycles
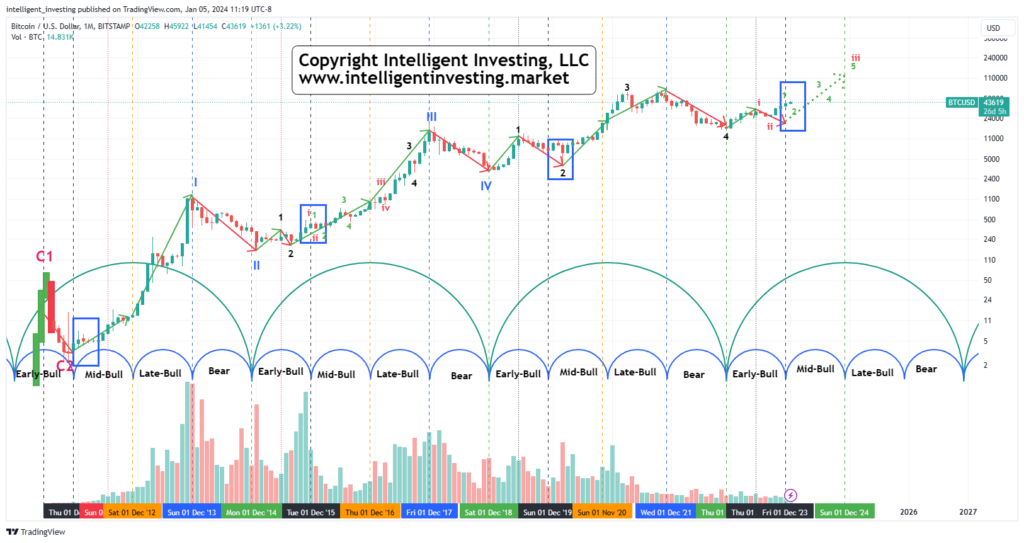
Thus, based on these cycles, in late November/early December Bitcoin moved from an early bull phase to a mid-bull phase, which will end in late 2024. The blue boxes in Figure 1 above show the previous three phases. What we found is that every time this happens
Transition Phase: Bitcoin struggles for a few months: it peaks around January +/- a month, bottoms out around February +/- a month with an average loss of around 20 +/- 5%, and then rises in
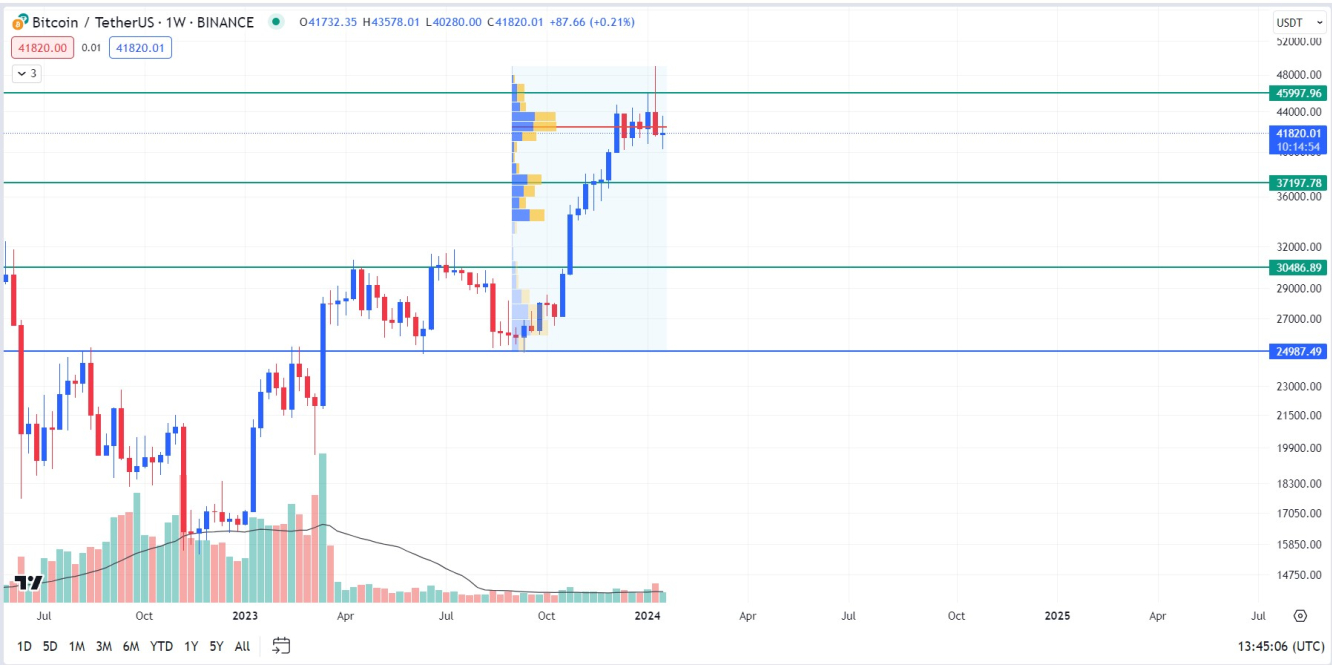
July +/- month. Therefore, we should expect the first quarter to be “weak,” and the second quarter to be strong. From the perspective of the Elliott Wave Principle (EWP), our basic forecast is for Bitcoin to be at wave W-2 in green branching off from W-iii in red, which corresponds to four-year cycles. See Figure 2 below.
Figure 2: Bitcoin daily chart with detailed Elliott waves and several technical indicators

Once the pullback of wave W-2 in green is complete, Bitcoin should free itself to W-3 in green from W-iii in red. See Figure 1. For those new to Elliott Wave analysis, please know that markets are fractal, and that the third wave group, in this case, the red W-iii, will split into five smaller waves: the green W-1 and the number continues until 5. At this point, Bitcoin remains only in phase W-1, 2, 3. Therefore, the idea that the second quarter should be strong also coincides.
We know from the Elliott Wave Principle that the fourth and fifth waves come after the third wave. Therefore, wave W-3 in green should reach its peak in the summer of 2024. At the end of the second quarter, like the mid-up phase in 2016. The third quarter will be reserved for wave W-4 (in green), followed by wave W-5 (in green). in green) that reach all-time highs by late 2024 or early 2025. Note that in 2012 and 2016, the mid-up phase was unable to create a new all-time high, but it did so in 2020. Thus, we expect that 2024 will be soon. Based on the Elliott Wave principle, the third wave often targets the 1.618x Fibonacci extension level of the previous W-1 wave, which is measured from the low of W-2. A rough estimate shows that the level of the W-1 wave in green was around $20,000 ($25->45,000). The value of the green W-3 should be $20,000 x 1,618 = $32.4,000. Assuming the green W-2 bottoms out at around $34.6k, we can calculate that the W-3 could reach $34.6k + $32.4k = $67k. Once the third quarter ends, in addition, the green W-4, ideally around $55,000, begins the green W-5 wave. It then depends on whether there is enough time left in the fourth quarter for this wave to cross $69,000. But it will be an interesting ending.
And so, as stated in many previous articles:
“We have been bullish on Bitcoin for some time… However, our bullish scenario is completely invalidated by a drop below $25K. Only when that happens will we change our overall long-term bullish view, which Bitcoin is proving to be healthier with every update.” We present it, based on previous Bitcoin cycles, consisting of four more secondary phases, which are currently in the “Mid-Bull Phase” and therefore close to the next bull run, which could target $100-200+K by the end of 2025